Blog
Notes on biomass layers, calibration plots and monitoring reports.
 Field notes: the year the registry asked why our numbers went up
A field-notes account of explaining a biomass increase with zero harvest activity, and why consistent year-over-year methodology was the real answer.
 GEDI lidar vs commercial biomass products: which anchors the regression
GEDI footprints or a commercial optical layer: what actually calibrates an AGB regression model, and what a registry reviewer expects to see documented.
 How to propagate measurement uncertainty into a landscape-scale biomass estimate
A working method for building the error budget behind a landscape-scale AGB estimate, from plot error to the confidence interval you report to a registry.
 What a root-to-shoot ratio is and why registries apply it to AGB data
How root-to-shoot ratios convert above-ground biomass into total biomass for carbon-stock reporting, and which IPCC defaults registries accept.
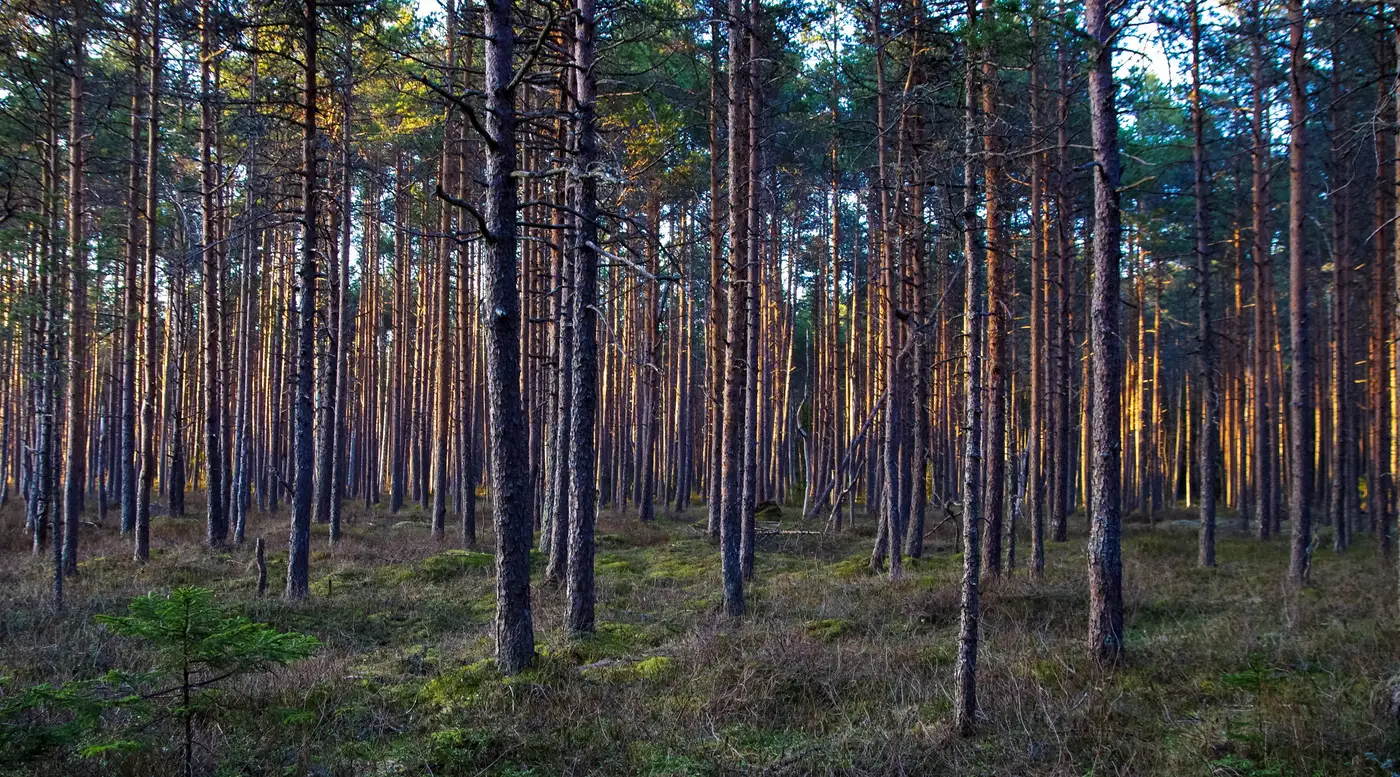 Field notes: the stand that broke the regression curve
Field notes on a two-cohort stand where canopy structure and spectral signal disagreed, and what it took to get the biomass number right.
- Handling mixed-species stands in a biomass regression model
How to stratify a biomass regression model by species group instead of pooling mixed-species stands into one curve.
- Biomass map vs carbon stock map: what's the difference
AGB layers measure biomass in dry-matter tonnes; carbon stock maps apply a carbon fraction and root-shoot ratio on top. Here's what separates them.
- Validating a biomass map against legacy plots, no new field work
How to validate a wall-to-wall biomass map against legacy plot data using a residual check, with no new field campaign required.
 Field notes: the defoliation year nobody called a disturbance
A mixed-hardwood block's biomass numbers dropped two years running. Nobody flagged it as a disturbance until the third pass caught the pattern.
 Carbon fraction of dry matter: why this one number decides your CO2e total
What carbon fraction of dry matter means, the IPCC default value, and how it converts biomass into a reportable CO2e figure.
- Model-based vs design-based inference for carbon stock estimation
A plain-language comparison of model-based and design-based inference for forest carbon stock estimates, and what each means for a registry submission.
 What a reference year means on a biomass map, and why registries ask for one
What a biomass map's reference year means, why registries tie it to baseline and monitoring dates, and what a vague vintage costs a submission.
- Wall-to-wall biomass mapping vs sample-based forest inventory
How landscape-scale biomass mapping compares to plot-based carbon inventory and stratified sampling for carbon registry reporting.
- Why optical biomass estimates saturate in high-biomass forests
A look at the spectral saturation point in dense canopy and why multispectral AGB models flatten out exactly where biomass is highest.
- Allometric equations vs. remote sensing biomass estimates
What allometric equations and remote sensing biomass estimates each measure, where species-specific allometry breaks, and how reviewers reconcile both.
- How many field plots do you actually need to calibrate a biomass model?
Plot count for biomass regression comes from variance and stratification, not a fixed rule. Here's how to size a calibration campaign that holds up.
- IPCC tier 1 vs tier 2 vs tier 3 for forest carbon reporting
What separates Tier 1 defaults from Tier 2 and Tier 3 forest carbon reporting, and what each tier actually demands from your inventory team.
- What is a biomass expansion factor? BEF in forest carbon accounting
A plain explanation of biomass expansion factors, how BEF converts stem volume to above-ground biomass, and where default values break down.