Why optical biomass estimates saturate in high-biomass forests
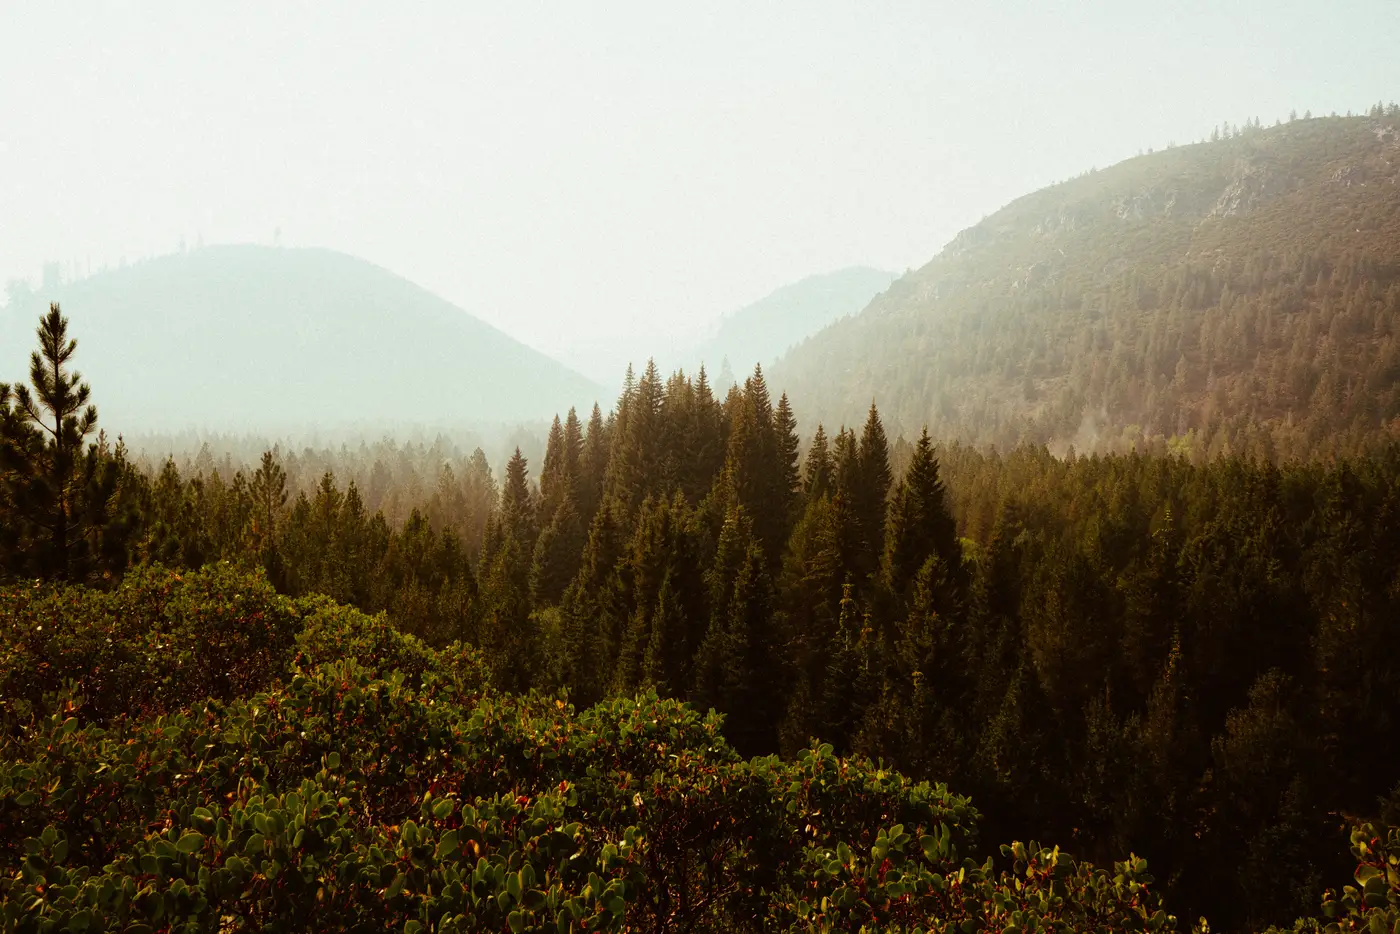
If you've reviewed a carbon project's biomass model and noticed the above-ground biomass numbers compress into a narrow band once canopy closure passes a certain point, you've seen spectral saturation in action. It's one of the oldest known limits in optical remote sensing for forestry, and it's still the thing project developers most often gloss over in their methodology write-ups.
What saturation actually looks like in the data
Optical sensors don't measure biomass directly. They measure reflected light in a handful of spectral bands, and a regression model translates that reflectance (often as a vegetation index like NDVI or EVI) into an AGB estimate. That relationship holds up well in young stands, regrowth, and open woodland, where more leaf area and more woody structure still show up as a clear change in reflectance.
The trouble starts once leaf area index climbs past roughly 4 to 6, which in most tropical and temperate forest types corresponds to somewhere between 150 and 300 Mg/ha of biomass, depending on species composition and canopy architecture. Past that point, the upper canopy is already reflecting about as much light as it's going to reflect. Adding more trunk volume, more understory structure, or more total carbon below that closed canopy doesn't change what the sensor sees from above. The index flattens. A stand with 250 Mg/ha and a stand with 400 Mg/ha can produce nearly identical spectral signatures, and the regression has no way to tell them apart.
This is why you'll sometimes see a biomass map where the highest-carbon strata in a project, old-growth blocks, primary forest reserves, the areas a registry most wants a defensible number for, show the flattest, least differentiated values on the map. The sensor has reached the limit of what reflectance alone can register.
Why this matters for carbon-stock review
For a technical reviewer, the saturation point is the part of the model that determines whether the reported uncertainty on high-biomass strata is honest. If a methodology leans on a pure spectral index without any structural proxy, canopy height, texture metrics, or a radar/LiDAR cross-check, the confidence interval on the densest strata should be wide, and the submission should say so in plain terms. A tight confidence interval next to a saturated index is usually a sign the uncertainty analysis didn't account for the ceiling effect, not a sign the estimate is good.
This is also why field-plot campaigns tend to concentrate exactly where optical saturation is worst. Allometric plots in high-biomass strata aren't there because the registry likes extra fieldwork. They're there because that's the one place the spectral model can't carry the estimate on its own, and someone has to ground-truth what the sensor can't separate.
Multispectral imagery still earns its place for canopy cover, disturbance detection, land-use change, and tracking biomass through the low-to-mid range, where most of a landscape's carbon turnover happens. The honest framing is that a single spectral band set has a working range, and a defensible AGB layer needs to say where that range ends for the forest type in question, and what's backing the estimate past that point.
Pairing canopy structure measures with spectral response, rather than running an index-only regression across the whole landscape including the stands where it's known to flatten out, closes that gap for the strata a registry cares about most. A biomass layer regressed from canopy structure and spectral response together holds up better precisely where single-index models stop differentiating.
If your next reporting cycle includes dense, mature stands, it's worth checking whether the methodology in front of you accounts for where the spectral signal gives out.