Above-ground biomass · AGB · Mg/ha
Landscape biomass as a raster, refreshed each year.
Above-ground biomass regressed from canopy structure and spectral response, delivered with the methodology note your reviewer will ask for.
Spec table
- GSD
- 10–30 m (wide-swath)
- Cadence
- Annual
- Platform
- Wide-swath satellite
- Spectral
- Multispectral
- Output
- Gridded above-ground biomass density
- Format
- GeoTIFF raster plus methodology note
- Scope
- One landscape or project boundary per pilot
The files
The pilot delivers one biomass layer for your boundary, then a refresh each year on the same grid so years compare cell by cell.
Above-ground biomass layer
- Format
GeoTIFF- What's in it
- A gridded raster of above-ground biomass density across your boundary, in the units of your calibration plots. It opens in QGIS, ArcGIS or R, and drops into the stratum table you already report from.
- Delivered
- Delivered once for the pilot year.
Canopy structure inputs
- Format
GeoTIFF- What's in it
- The structure signal derived from the imagery and used in the regression, delivered as its own layer so your analyst can see what the biomass surface rests on and run their own checks against it.
- Delivered
- With the biomass raster.
Annual refresh
- Format
GeoTIFF- What's in it
- Comparable year over year, so a change between two monitoring points is a difference of two rasters you can inspect.
- Delivered
- The next year's layer on the same grid, made from a pass in the same season.
Methodology note
- Format
PDF- What's in it
- The regression basis, the calibration data used, the imagery dates, and the known limitations for your landscape, written to go into a monitoring report or a project description.
- Delivered
- Delivered with every layer.
How it works
You supply
Supply the boundary and your plots
A landscape or project boundary as a shapefile or GeoPackage. If you have calibration plot data, send it with coordinates and measurement dates. The layer is calibrated against your ground data.
shapefileGeoPackageWe do
Imagery pass
One wide-swath multispectral pass per year, chosen from the clearest window in a consistent season.
We do
Regression
The spectral response and the canopy structure signal are regressed to plot biomass density across the boundary.
Comes back
Delivery
The biomass raster, the structure layer and the methodology note. Refresh dates are agreed in the pilot scope.
GeoTIFFPDF
Limits
10–30 m is a density surface
- Effect
- Each cell covers a patch of forest, not a tree. The layer gives biomass density across a landscape and cannot count or measure individual trees.
It needs ground data
- Effect
- The regression is calibrated against calibration plots. Without ground data for your landscape the layer cannot be fitted, and plots are not included.
Dense canopy saturates
- Effect
- Where the canopy is very dense, the imagery signal stops rising with biomass, and the layer tends to understate the highest stocks.
- In the delivery
- The methodology note says where this bites in your landscape.
Cloud thins some years
- Effect
- Cloud in the growing season decides which pass is usable. In persistently cloudy regions, some cells rest on thinner imagery.
- In the delivery
- The note flags them.
Annual, not continuous
- Effect
- One layer a year. Events between passes, such as a clearing or a fire, show up at the next annual layer.
A technical input
- Effect
- The layer feeds a registry methodology or an inventory. It does not decide credit issuance or verification, which sit with the registry and your verification body.
Why this exists
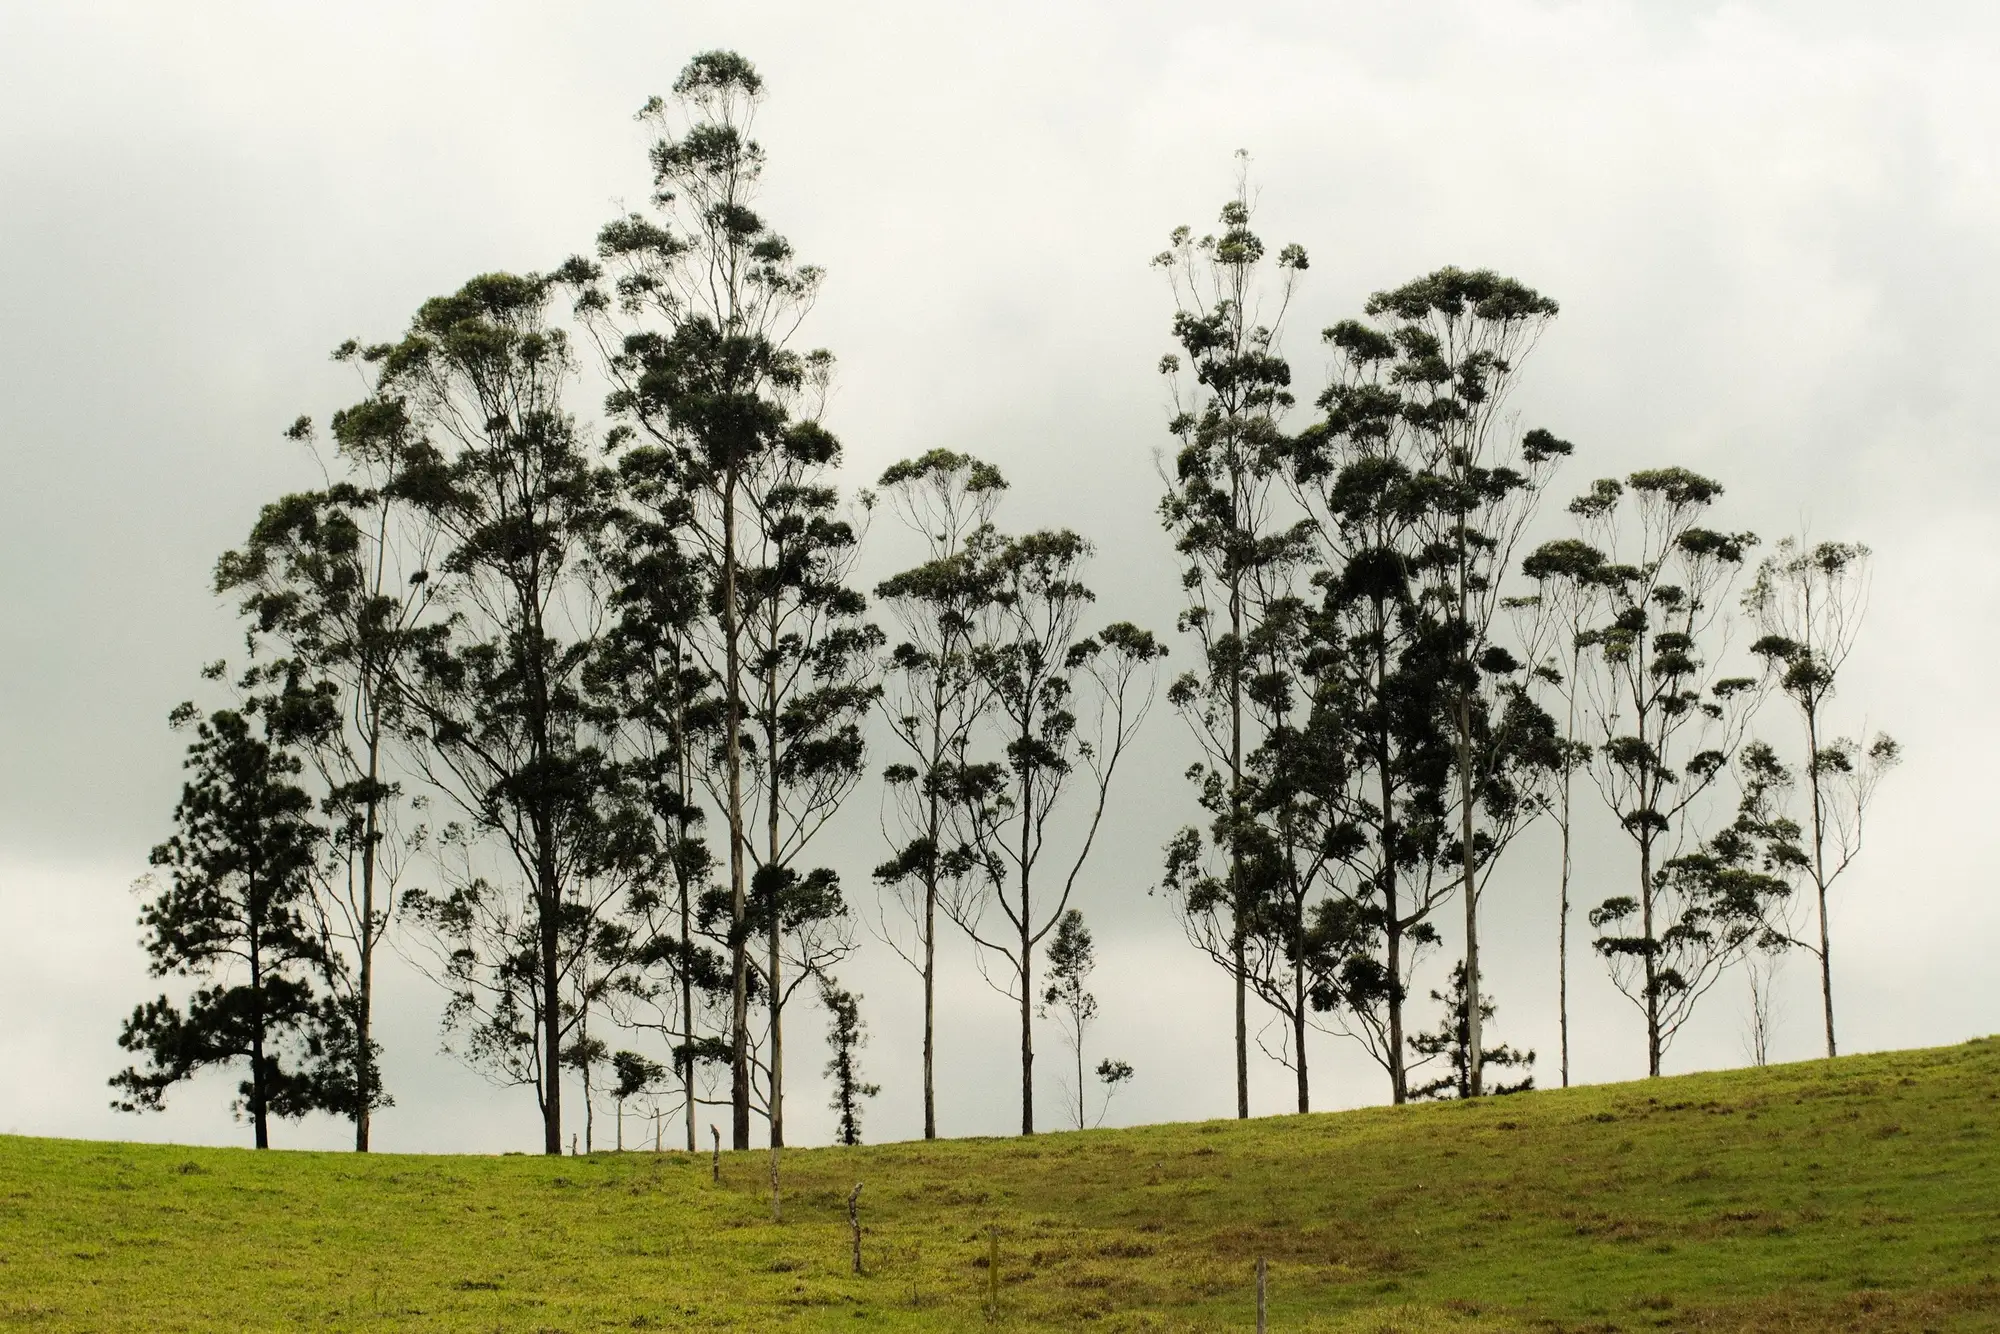
Your stock estimate comes from calibration plots expanded across strata, or from a consultant's remote-sensing study fitted once and never rerun. Every monitoring cycle you either send crews back into the field or lean on the last study. When a reviewer asks how the stock has moved since the baseline, the honest answer is a plot campaign that has not been funded. This gives you a repeatable landscape layer to sit beside the plots, so the plot budget goes to calibration and checking instead of blanket coverage.
Who it's for
For
- Registry technical reviewers and verification body staff checking a landscape biomass estimate.
- Government forestry analysts who need a landscape biomass surface for an inventory or a reporting cycle.
- Project developers with calibration plots who want a repeatable layer between field campaigns.
Not for
- Anyone hoping to drop ground plots. The layer is calibrated against them.
- Tree-by-tree measurement or stem counting. At 10–30 m that takes lidar or drone work.
- Teams wanting a credit-issuance decision. That sits with the registry.
- Continuous or event-driven monitoring. This is one layer a year.
Technical and procurement questions
Does this replace ground calibration plots?
No. The regression is fitted and checked against your plots. The layer spreads that signal across the landscape.
Does it resolve individual trees?
No. At 10–30 m it is a landscape-scale density layer.
Can we use the figures for credit issuance directly?
Treat it as a technical input. Registry rules and your verification body decide what counts, and the methodology note is written for that conversation.
How do we check it against our own plots?
Hold back a set of plots from the calibration, and compare them against the raster cell values. Tell us which plots you want held out when the pilot is scoped.
What about cloud cover?
Cloud in the growing season decides which pass is usable. Persistently cloudy landscapes can have thinner imagery, and the note says where.
Can it run mid-crediting-period?
Yes. The annual cadence suits monitoring through a period, and the baseline year sets the grid the later years follow.
What do we hand over?
A boundary, and calibration plot data if you have it. We do not need access to your inventory system.
Who owns the delivered layers?
Use and ownership terms are written into the contract before work starts. Imagery licensing is covered in the scope.
How is it priced?
Each pilot is scoped on its own, from the size of the landscape and the number of annual refreshes. You get a written scope to take through procurement.
Send the boundary and we'll scope a pilot.
Or ask about your landscape .