Field notes: the stand that broke the regression curve
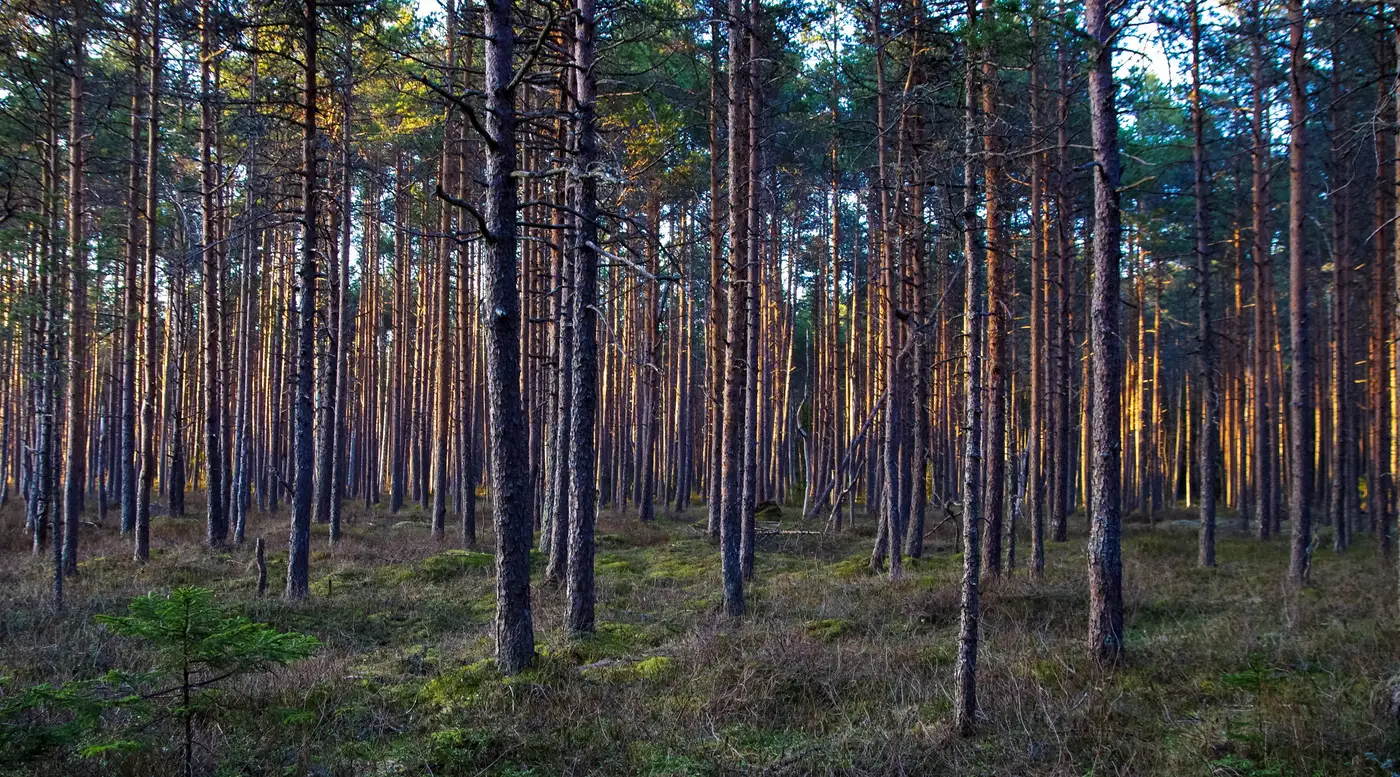
We found it on plot 14, a half-acre fixed-radius sample on the north slope above the old mill pond. The cruiser's tally sheet said something the regression didn't want to hear: 340 tons per hectare of above-ground biomass, measured tree by tree with a relascope and a diameter tape, in a stand the spectral model had pegged at 210.
A 38% miss is the kind of residual that gets a plot flagged, re-measured, and argued about in a Tuesday afternoon call with the registry reviewer.
The stand itself explains a lot, once you walk it instead of just looking at the raster. It's a two-cohort stand: a thinned, even-aged cohort of Douglas-fir planted after a 1970s harvest, with a dense layer of naturally regenerated hemlock and cedar that came in underneath over the following decade and never got touched. From above, the canopy reads as one thing. NDVI and the red-edge bands see a closed, uniform, moderately vigorous canopy, the kind of signal that usually correlates with mid-range stocking. What the sensor can't see is the second story: fifteen- and twenty-inch hemlock stems packed in under the fir crowns, contributing enormous basal area and volume while staying almost entirely out of view from nadir.
This is the canopy structure versus spectral mismatch that shows up in every biomass model sooner or later: a single reflectance signature can only tell you so much about a layered canopy, no matter how good the allometry underneath it is. A regression trained on canopy height and spectral greenness assumes those two things move together in a fairly consistent way across the landscape. They mostly do. Then you hit a stand like 14, where forty years of light suppression have built a basement nobody can see from the street.
We've started calling these outlier stands "basement stands" internally, half as a joke, half because it's the fastest way to explain the problem to someone who hasn't walked one. The polite term is a biomass model outlier, and every analyst who's run a cruise program long enough has a list of them. They cluster in predictable places once you know to look: old shelterwood units with heavy advance regeneration, riparian buffers where understory conifer has had decades to fill in, anywhere a partial harvest left a residual overstory thin enough to let a lot of biomass grow in the shade of it.
The spectral layer still earns its place in the regression; it just needs a correction term for structure that the canopy surface alone can't supply. Forestry field verification is where that correction gets built, concentrated on the stands that don't fit the curve. A revisit sends the field crew to the stands where the model's confidence interval is widest, where height and greenness tell two different stories, and puts boots and a tape on a handful of plots there. That's a much smaller, much cheaper campaign than a wall-to-wall re-measure, and it's the difference between a biomass layer a registry reviewer will sign off on and one that gets kicked back with a note asking for supporting plot data.
Plot 14 got re-measured twice before anyone believed the first number, and both re-measures came back within five tons of the original 340. The stand is still in the stand table as an outlier, with a note attached about the two-cohort structure, and it's one of the reasons the biomass layer for that management unit gets flagged for a targeted field check every cycle instead of being taken on faith. That's a cheaper habit than flying a fresh plot campaign across the whole ownership, and it's the premise behind a biomass layer built to be checked and refreshed rather than re-measured from scratch every year.
If your stand tables have a plot like 14 sitting in them, it might be worth seeing what the regression says about it.